Remove false-positive health check Failures in Azure API Management

A client of mine has the following configuration for many of their apps

  • Azure API Management (Consumption plan) in front of an
  • Azure Service Bus Topic and
  • An Azure Function to process messages from the topic, with
  • Azure Application Insights for monitoring everything and
  • A static metric alert rule against the Application Insights instance, for Exceptions > 0 which
  • Sends an email to an MS Teams email address which
  • Posts an alert to MS Teams, whenever any exception occurs

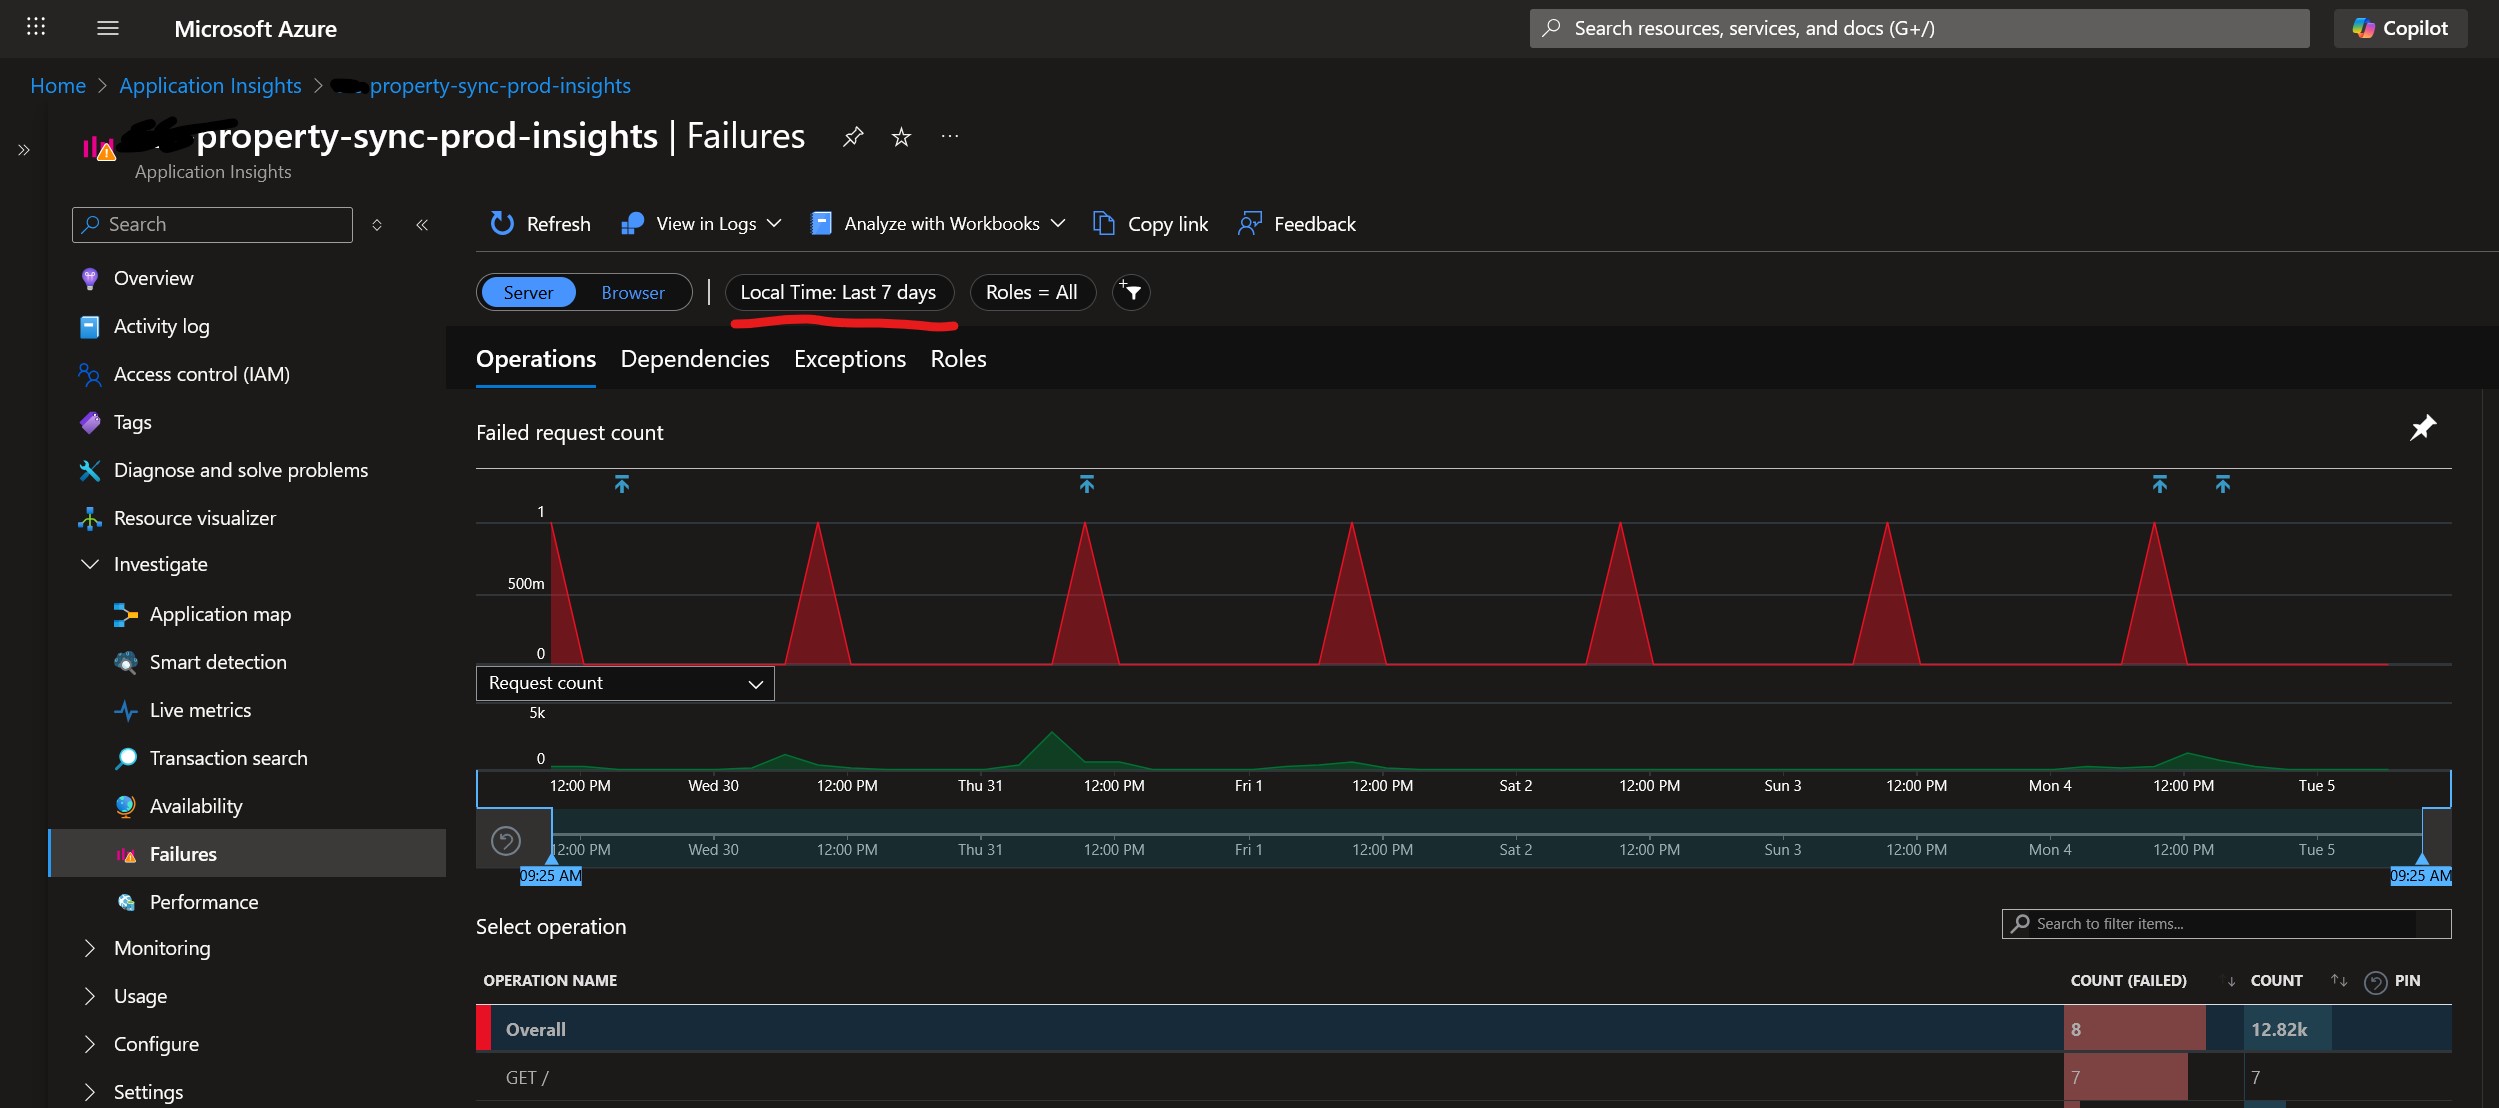
Every day at around the same time, something mysterious (which doesn’t belong to us) pings all of their Azure API Management instances at site root, i.e. GET /. We don’t know what it is, but I guess it’s something to do with Azure Monitoring or infrastructure, or a keep alive or something. Our APIM doesn’t have anything at site root /, so it returns a 404. This 404 is counted as an Exception which is logged as a regular Failure in Application Insights:

Application insights showing a failure at 9:20am every day for the last 7 days

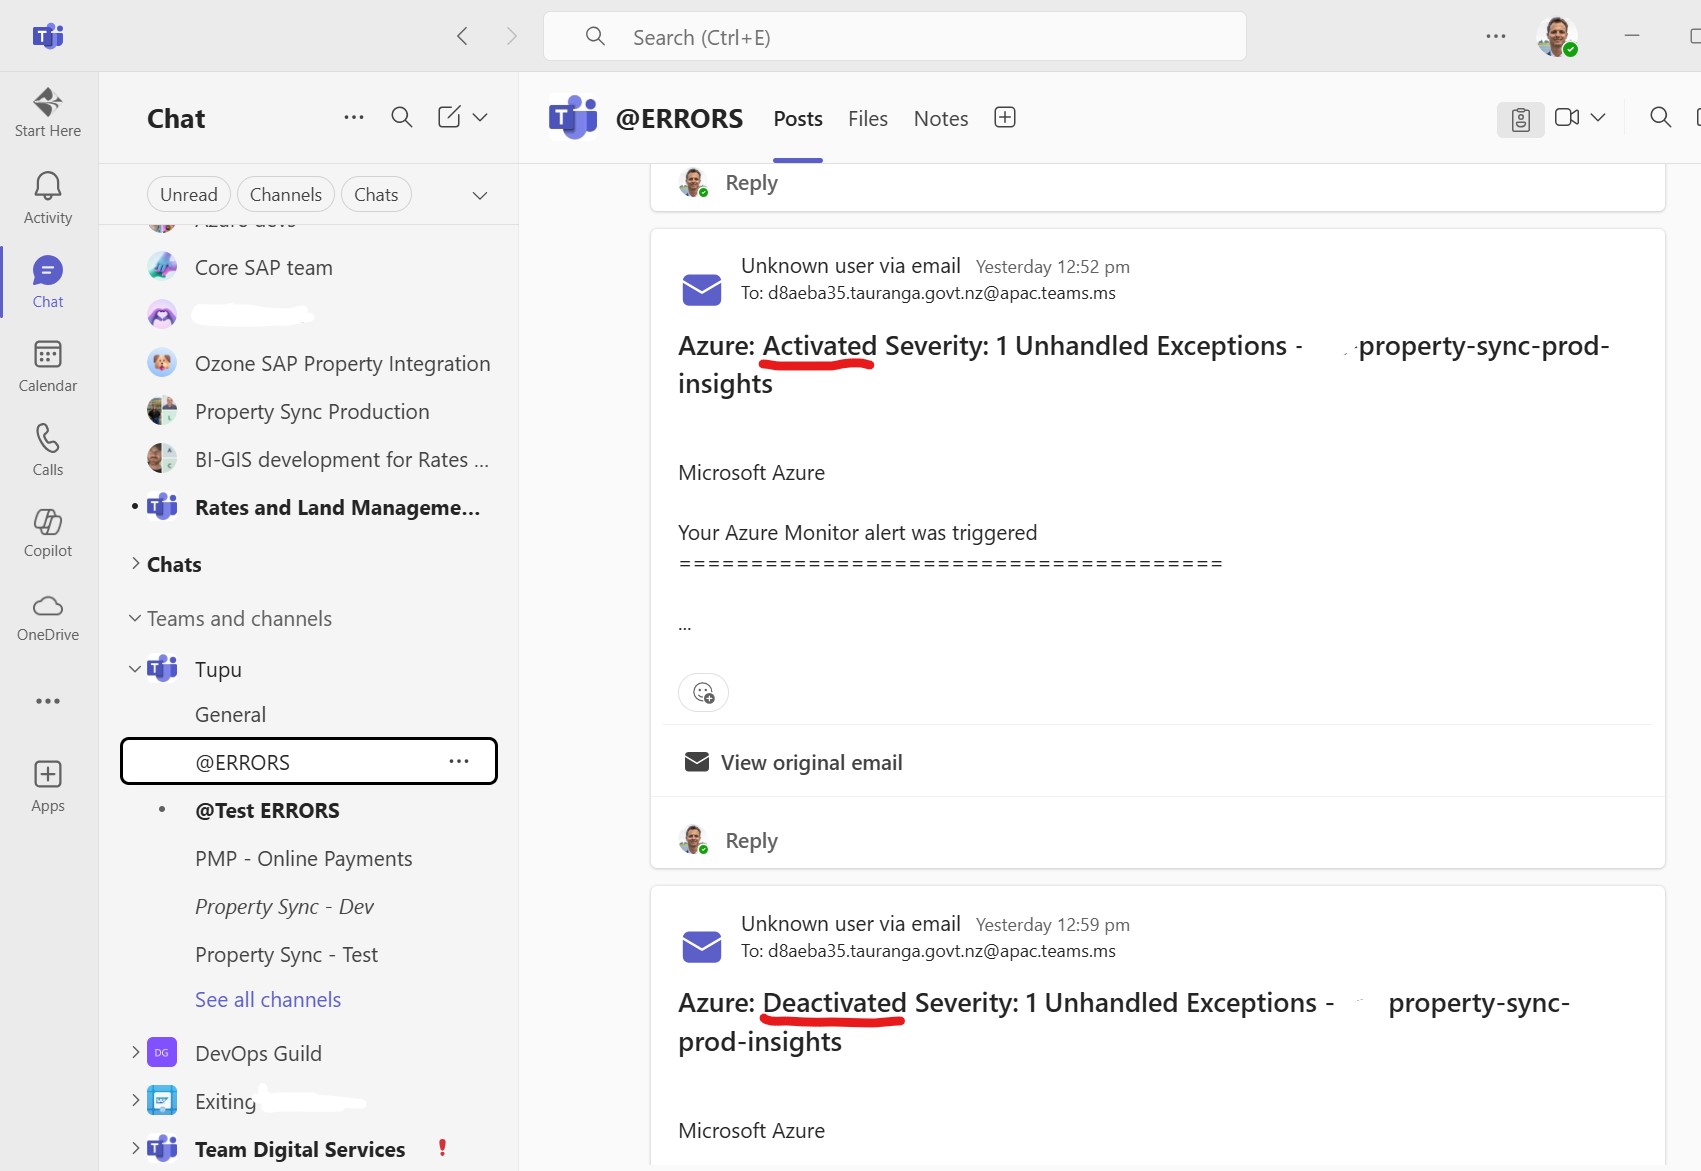
Which means every day at the same time we get false positive alerts (activated + deactivated) in our Teams channel:

MS teams alerts

The workaround is quite simple – add a “health check” endpoint at APIM’s site root to return a 200 instead of a 404. We can use APIM’s mock-response for this:

Azure API Management API showing an endpoint

N.B. make sure the API’s URL scheme is both HTTP and HTTPS.

The inbound policy looks like this:

<policies>
  <inbound>
    <base />
    <rate-limit calls="1000" renewal-period="60" />
    <mock-response status-code="200" content-type="application/json" />
  </inbound>
  <backend>
    <base />
  </backend>
  <outbound>
    <base />
  </outbound>
  <on-error>
    <base />
  </on-error>
</policies>

And here’s a Bicep snippet to deploy it. Pro-tip: you can use ”’ to embed the XML:

resource healthPolicy 'Microsoft.ApiManagement/service/apis/operations/policies@2023-05-01-preview' = {
  parent: healthOperation
  name: 'policy'
  properties: {
    format: 'xml'
    value: '''
<policies>
  <inbound>
    <base />
    <rate-limit calls="1000" renewal-period="60" />
    <mock-response status-code="200" content-type="application/json" />
  </inbound>
  <backend>
    <base />
  </backend>
  <outbound>
    <base />
  </outbound>
  <on-error>
    <base />
  </on-error>
</policies>
'''
  }
}

Hopefully that helps someone.

Edit, a few days later:

Once we implemented the mock-response, that didn’t fix the problem of the alerts being fired. Whatever is calling us has a very short timeout, so our 404s became replaced with ClientConnectionFailure exceptions.

The workaround I settled on is to change our static metric alert on “Exceptions > 0” to a Custom Log search, and I explicitly exclude errors when calling the site root URL, with a custom query

exceptions
| where operation_Name != “GET /”
| project TimeGenerated = timestamp, problemId

azure portal alert rule

Customize Blazor WASM sidebar per environment

Our client wanted to have a slightly different color scheme for our internal application for each environment, i.e. dev, test and production.

I implemented this by injecting an IConfiguration which I wrote about in 2024.

The component we need to change is in MainLayout.razor, the div with class=”sidebar”.
I’m not sure how to change the css via code, or if it’s possible, so I used an inline style to the div.

MainLayout.razor:

@inherits LayoutComponentBase
@inject IConfiguration Configuration
<div class="page">
    <div class="sidebar" style="background-image: linear-gradient(180deg, @SidebarTopColor 0%, @SidebarBottomColor 70%);">
        <NavMenu />
    </div>
<FluentDialogProvider />
<FluentTooltipProvider />
<FluentMessageBarProvider />

@code {
    private string SidebarTopColor = "#052767"; // dark sapphire blue - these are the Blazor default colors
    private string SidebarBottomColor = "#3a0647"; // dark purple
    protected override void OnInitialized()
    {
        var environment = Configuration["Environment"]?.ToLowerInvariant() ?? "local";
        switch (environment)
        {
            case "dev":
                SidebarTopColor = "#b4b369"; // yellowy greeny
                SidebarBottomColor = "#545432"; // dark olive green
                break;
            case "test":
                SidebarTopColor = "#40651b"; // greenish
                SidebarBottomColor = "#294211"; // dark green
                break;
            case "prod":
                SidebarTopColor = "#0854A0"; // victoria blue
                SidebarBottomColor = "#354a5f"; // dark blue grey
                break;
        }
    }
}

PSA: Bicep templates run in parallel

I had a problem recently where my Bicep templates were failing with an obscure error message:

The incoming request is not recognized as a namespace policy put request.

The Bicep in question was attempting to assign an Azure Service Bus topic subscription’s forwardTo to another queue.

I had ordered everything in the Bicep file correctly, i.e.

  1. Create the topic
  2. Create its subscriptions
  3. Create the queues
  4. Tell the topic subscription to forward messages to the queue

However, when I looked at the Deployments in the Azure Resource Group, it appeared that they weren’t running in the order I had specified:

This is because by default Bicep templates will run in parallel, unless it detects dependencies. And because my templates were a bit too clever with variables and modules, Bicep was unable to detect my implicit dependencies.

The fix then was to be explicit with my dependencies, using the dependsOn keyword:

// create service bus topics And subscriptions
param topicsAndSubscriptions array = [
  {
	topicName: 'property~changed~v1'  // ~ is what Azure uses for a forward slash, so this topic is actually property/changed/v1
	sanitizedName: 'property-changed' // Azure doesn't like ~ or / in deployment names.
	subscriptions: [
	  'ozone'
	  'valor'
	]
  }
]

module serviceBusTopicsModule './serviceBusTopic.bicep' = [for item in topicsAndSubscriptions : {
  name: 'serviceBusTopic-${item.sanitizedName}-${deploymentNameSuffix}'
	params: {
	serviceBusName: serviceBusModule.outputs.serviceBusOutput.name
	topicName: item.topicName 
  }
}]

module topicsSubscriptionModule 'serviceBusTopicSubscription.bicep' = [ for item in topicsAndSubscriptions: {
  name: 'topicSubscription-${item.sanitizedName}-${deploymentNameSuffix}'
  params: {
	serviceBusName: serviceBusModule.outputs.serviceBusOutput.name
	topicName: item.topicName
	subscriptions: item.subscriptions
  }
  dependsOn: serviceBusTopicsModule
}]

// Create service bus queues
param queueSettings array = [
	{	
		name: 'ozone-property-changed-sbq'
		requiresDuplicateDetection: true
	}
	{
		name: 'valor-property-changed-sbq'
		requiresDuplicateDetection: false
	}
]

module serviceBusQueueModule './serviceBusQueue.bicep' = {
  name: 'serviceBusQueue-${deploymentNameSuffix}'
  params: {
	serviceBusName: serviceBusModule.outputs.serviceBusOutput.name
	queueSettings: queueSettings
  }
}

module serviceBusTopicSubsciptionForwardModule './serviceBusTopicSubscriptionForward.bicep' = {
  name: 'serviceBusTopicSubsciptionForward-${deploymentNameSuffix}'
  params: {
	serviceBusName: serviceBusModule.outputs.serviceBusOutput.name
	topicName: 'property~changed~v1'
	subscriptionName: 'valor'
	queueName: 'valor-property-changed-sbq'
  }
  dependsOn: [serviceBusQueueModule, topicsSubscriptionModule]
}

Azure DevOps Advanced Security not detecting vulnerabilities – 0 components found

Today at a client I noticed that when I built a solution in Visual Studio, I would get Warnings about security vulnerabilities in third party NuGet packages:

A screenshot from Visual Studio showing NuGet vulnerabilites as Warnings in the Error List.

We had previously setup Azure DevOp’s “Advanced Security” in our Build pipelines a while ago, so we should have already been alerted to this vulnerability, by the AdvancedSecurity-Dependency-Scanning@1 task. When I looked at the task’s output, it was rather empty:

0 components found

This is because the AdvancedSecurity-Dependency-Scanning@1 task needs to have the packages already downloaded – by either doing a dotnet restore first, or a dotnet build.

The code scanning pipeline looked like this:

steps:
- task: NuGetAuthenticate@1 # needed to authenticate for our private NuGet feed
- task: AdvancedSecurity-Codeql-Init@1
  inputs:
    languages: "csharp"
- task: AdvancedSecurity-Dependency-Scanning@1
- task: AdvancedSecurity-Codeql-Autobuild@1
- task: AdvancedSecurity-Codeql-Analyze@1
- task: AdvancedSecurity-Publish@1


You’ll notice that I already have an “Autobuild” task there. The fix then was to move the AdvancedSecurity-Dependency-Scanning@1 to after the AdvancedSecurity-Codeql-Autobuild@1 task:

steps:
- task: NuGetAuthenticate@1 # needed to authenticate for Tcc.Common@Local NuGet feed
- task: AdvancedSecurity-Codeql-Init@1 # Initializes the CodeQL database in preparation for building.
  inputs:
    languages: "csharp"
- task: AdvancedSecurity-Codeql-Autobuild@1 # Build project for CodeQL analysis 
- task: AdvancedSecurity-Codeql-Analyze@1 # Analyzes the code to find security vulnerabilities and coding errors.
- task: AdvancedSecurity-Dependency-Scanning@1 # scans NuGets for vulnerabilities - this needs to be after the autobuild task.
- task: AdvancedSecurity-Publish@1 # Publishes the results of the analysis to the Azure DevOps pipeline.


Once that was done the task detected 237 NuGet components:

237 components found on NuGet

I could now see a vulnerability reported as a Build warning:

build warning

and the specific vulnerability on the Repo’s Advanced Security page:

advanced security warning of Microsoft CVE advisory

Remove a secret from your local git commit history

I was recently trying to push some code to Azure DevOps, but I was getting an error:

$ git push
Enumerating objects: 117, done.
Counting objects: 100% (107/107), done.
Delta compression using up to 12 threads
Compressing objects: 100% (66/66), done.
Writing objects: 100% (69/69), 10.28 KiB | 1.28 MiB/s, done.
Total 69 (delta 42), reused 0 (delta 0), pack-reused 0
remote: Analyzing objects... (69/69) (105 ms)
remote: Validating commits... (5/5) done (2 ms)
remote: Checking for credentials and other secrets... done (906 ms)
error: remote unpack failed: error VS403654: The push was rejected because it contains one or more secrets.
To https://dev.azure.com/xxx/Software/_git/Property.Sync
! [remote rejected] feature/teams-logging -> feature/teams-logging (VS403654: The push was rejected because it contains one or more secrets.

Resolve the following secrets before pushing again. For help, see https://aka.ms/advancedsecurity/secret-scanning/push-protection.

Our Azure DevOps repository has GitHub Advanced Security enabled, hence the above error. Pretty cool feature.

The code I’m pushing doesn’t have the secret in it anymore – an early POC commit had the secret in, when I was playing around to see if I could get it to work. But then I removed the secret once I’d gotten it working.

The suggested fix is to muck around with git rebase and remove the secret from the older commit. Since I don’t care about intermediate commits in my feature branches, an easier workaround is to squash all commits in the branch, thus removing the secret from the history.

As usual with git, there’s a million different and confusing ways to do the same thing. I usually go for the simplest method. Here’s how I did it:

  1. create a new branch based off develop and switch to it git checkout -b feature/my-new-branch
  2. Squash merge all of the commits in my feature branch into the new branch git merge --squash feature/my-old-branch
  3. Commit and push my new branch (so that I can create a pull request into develop branch)

“When a Teams webhook request is received” not working from C# HttpClient

I was recently trying to send a message from my application (an Azure Function) to a Teams channel.

The current recommended way (by Microsoft) to do this is via a “Teams Workflow”, which is layer over top of Microsoft Power Automate, which is a layer over Logic apps.

Here’s my Teams Workflow:

Here’s the same Teams Workflow in Power Automate:

Here’s a slightly different one, which I wrote as an Azure Logic App. Here the first step is “When a HTTP request is received”:

In both cases, I was able to trigger the Power Automate / Logic app fine from Postman, but when I tried from C# code using HttpClient.PostJsonAsync it failed.

The only difference I could see between the Postman request and the HttpClient request was that HttpClient was sending a transfer-encoding=chunked header.

I re-wrote my code to use PostAsync instead, and then it worked fine.


using HttpClient client = new();
client.DefaultRequestHeaders.Accept.Clear();
client.DefaultRequestHeaders.Accept.Add(new MediaTypeWithQualityHeaderValue("application/json"));

var card = AdaptiveCard.ExceptionCard("parcel.changed.v1", "I800100081376", "dev", new InvalidOperationException());

var url = "https://prod-31.australiasoutheast.logic.azure.com:443/workflows/dda945b5337d48....";

// await client.PostAsJsonAsync(url, card); // this sends a transfer-encoding=chunked header, which Power Automate & Logic Apps doesn't handle

var json = JsonSerializer.Serialize(card);
var content = new StringContent(json, System.Text.Encoding.UTF8, "application/json");
await client.PostAsync(url, content);

Logging to Application Insights with ILogger in Azure functions on .NET 8

Today I couldn’t figure out why any of my ILogger messages in my Azure Function weren’t appearing in Application Insights. According to my research they should appear as Trace messages.

logger.LogInformation("Message ID: {id}", message.MessageId);


I tried various Log Level tweaks to host.json to no avail.

Fortunately one of my colleagues (hi Ivan!) had previously had the same issue, and he’d already found the fix, which is documented here.

Turns out that dotnet-isolated Functions work a bit differently.


var host = new HostBuilder()
    .ConfigureFunctionsWebApplication()
    .ConfigureServices((context, services) =>
    {
        services.AddApplicationInsightsTelemetryWorkerService();
        services.ConfigureFunctionsApplicationInsights();
    })
    .ConfigureLogging(logging =>
    {
        logging.Services.Configure<LoggerFilterOptions>(options =>
        {
            // https://learn.microsoft.com/en-us/azure/azure-functions/dotnet-isolated-process-guide?tabs=windows#managing-log-levels
            // By default, the Application Insights SDK adds a logging filter that instructs the logger to capture only warnings and more severe logs.
            // To disable this behavior, remove the filter rule as part of service configuration:
            var defaultRule = options.Rules.FirstOrDefault(rule => rule.ProviderName == "Microsoft.Extensions.Logging.ApplicationInsights.ApplicationInsightsLoggerProvider");
            if (defaultRule is not null)
            {
                options.Rules.Remove(defaultRule);
            }
            // Set log level to Information so that we don't log traces
            var loggingRule = new LoggerFilterRule("PropertySync", null, LogLevel.Information, null);
            options.Rules.Add(loggingRule);
        });
    })
    .Build();

azure application insights

A nicer free Blazor WASM Data grid, toast, and confirm

A Blazor WASM .NET 8 proof-of-concept project I recently worked needed a data grid.

  • MudBlazor, at the time, it didn’t support .NET 8 WASM. (It might now, I’m not sure).
  • Blazorise – looks good, but I didn’t want the client to pay, because it’s a POC.
  • QuickGrid – used this for the initial version. Easy to use, but needs CSS skills to customize.
  • FluentDataGrid – much prettier, and easier to use than the QuickGrid. Almost a drop-in replacement for the QuickGrid.

QuickGrid

I initially started out with QuickGrid. After tweaking the CSS to get the column widths right, the result was this:

I would have liked the text to overflow … and show the full text on hover. I played around with the CSS and it kinda worked, but it wasn’t great.

FluentDataGrid

Later I found the FluentDataGrid, which is part of FluentUI Blazor. It already has the overflow with tooltip:

Dialog

You would think that Blazor would have a built-in easy way to popup a confirm message to the user, but it doesn’t come with any. The only way I could find was to use an old-fashioned javascript confirm:


bool confirmed = await JsRuntime.InvokeAsync<bool>("confirm", $"Are you sure you want to resend {loggedEvent.MessageBody}?");
if (confirmed)
{

// do stuff

Which is pretty basic.

FluentUI Blazor’s dialog is a bit prettier:


var dialog = await _dialogService.ShowConfirmationAsync($"Are you sure you want to resend {loggedEvent.EventType} for {loggedEvent.Id}?");
var result = await dialog.Result;

if (!result.Cancelled)
{

// do stuff

Notifications

FluentUI Blazor also has a ToastService for easily showing a pop-up (like how toast pops-up when it’s ready) to notify users.


_toastService.ShowSuccess($"{loggedEvent.Id} was resent.");


Add authentication to an Azure Static Web App’s API

At my current client we are writing a Blazor WASM app which is deployed as a Static Web App. The backend is an Azure Function which is deployed as a “Bring your own” function, however I think this still applies if the backend is a Managed Function.

The static web app is hosted in Azure at https://calm-ocean.33.azurestaticapps.net/. All of it’s pages are protected with OAuth on Microsoft Entra ID (formerly Azure AD).

The API is an Azure function with an HTTP endpoint at say https://my-func.azurewebsites.net/api/blogs.

At first this endpoint had no authentication, meaning it can be called directly and return a 200.

I then linked the Static Web App to the Azure function, which adds an “Azure Static Web Apps” Identity provider to the Azure Function, which means only the Static Web app can call the Function.

Azure portal screenshot

After linking, if I try call my function endpoint at https://my-func.azurewebsites.net/api/blogs it now returns a 400 (it should probably return a 401).

The security hole

The Static Web App (https://calm-ocean.33.azurestaticapps.net/) proxies any calls to the function’s endpoints at https://calm-ocean.33.azurestaticapps.net/api.

This means that by default, unauthenticated users can still call the API but via the Static Web App, i.e. https://calm-ocean.33.azurestaticapps.net/api/blogs – even though all other pages are protected by OAuth! Which is a big security hole 😱

The fix

The fix is quite simple. Specify that all routes should be locked down in the staticwebapp.config.json file (except our Blazor authentication pages):

{
 "routes": [
    {
      // Our Blazor pages have authentication via the [Authorize] attribute (in _Imports.razor).
      // Blazor's auth routes are at authentication/*, so allow anonymous access to them.
      // FYI, Azure Static Web App's built-in auth is at .auth/
      "route": "authentication/*",
      "allowedRoles": [ "anonymous" ]
    },
    {
      // Our API is an Azure function which is proxied on the "api" route. We don't want to allow anonymous access! We need to specify that calls to api/* are authenticated.
      // Let's lock down the whole site, so that requests to any page will need SWA auth, which is then passed on to our api/* calls.
      "route": "/*",
      "allowedRoles": [ "authenticated" ]
    }
  ],
  "responseOverrides": {
    "401": {
      "statusCode": 302,
      "redirect": "/.auth/login/aad"
    }
  }
}

Once deployed to Azure, if you try call the API directly (i.e. in an incognito browser window), you’ll be redirected to login.
One obvious gotcha is that this won’t work when you’re debugging locally, because your local function will be on a completely different port and isn’t proxied.

Pro tip: if you’re having trouble getting this to work, you can navigate to /.auth/me on your Static Web App to see the information about the currently logged in user. If you don’t see anything then you can sign in at /.auth/login/aad. These .auth routes are built-in to Azure Static Web Apps.

PS. after figuring all this out, I found this page which is a thorough treatment of how to combine Azure Static Web App’s authentication with Blazor WASM. Personally I haven’t needed to go that far myself – I’m so far only using the guides I’ve linked to above to do Blazor authentication.